Use my Search Websuite to scan PubMed, PMCentral, Journal Hosts and Journal Archives, FullText.
Kick-your-searchterm to multiple Engines kick-your-query now !>
A dictionary by aggregated review articles of nephrology, medicine and the life sciences
Your one-stop-run pathway from word to the immediate pdf of peer-reviewed on-topic knowledge.

suck abstract from ncbi


10.1371/journal.pone.0248500

http://scihub22266oqcxt.onion/10.1371/journal.pone.0248500

suck pdf from google scholar
33930013!8087083!33930013
unlimited free pdf from europmc33930013    free
PDF from PMC    free
html from PMC    free

suck abstract from ncbi


Deprecated: Implicit conversion from float 233.6 to int loses precision in C:\Inetpub\vhosts\kidney.de\httpdocs\pget.php on line 534
Deprecated: Implicit conversion from float 233.6 to int loses precision in C:\Inetpub\vhosts\kidney.de\httpdocs\pget.php on line 534

Deprecated: Implicit conversion from float 233.6 to int loses precision in C:\Inetpub\vhosts\kidney.de\httpdocs\pget.php on line 534
pmid33930013      PLoS+One 2021 ; 16 (4): e0248500
Nephropedia Template TP

gab.com Text

Twit Text FOAVip

Twit Text #

English Wikipedia


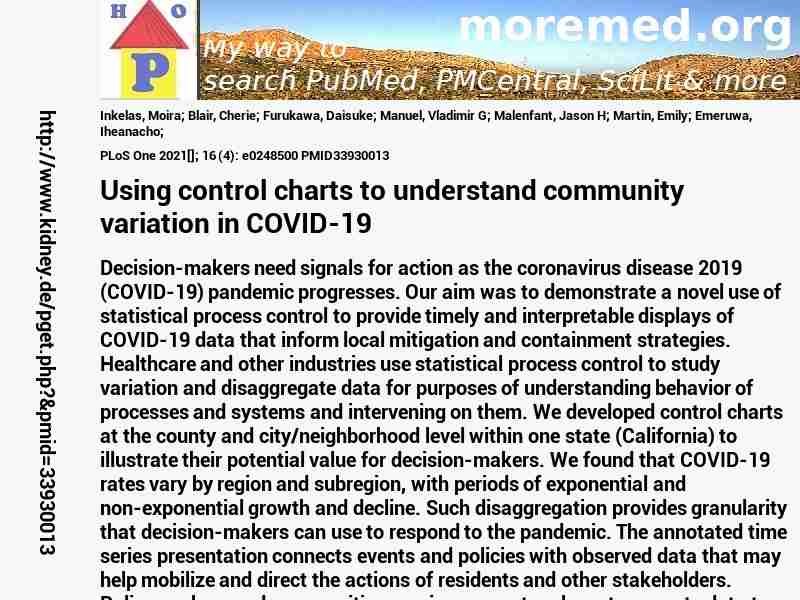
  • Using control charts to understand community variation in COVID-19 #MMPMID33930013
  • Inkelas M; Blair C; Furukawa D; Manuel VG; Malenfant JH; Martin E; Emeruwa I; Kuo T; Arangua L; Robles B; Provost LP
  • PLoS One 2021[]; 16 (4): e0248500 PMID33930013show ga
  • Decision-makers need signals for action as the coronavirus disease 2019 (COVID-19) pandemic progresses. Our aim was to demonstrate a novel use of statistical process control to provide timely and interpretable displays of COVID-19 data that inform local mitigation and containment strategies. Healthcare and other industries use statistical process control to study variation and disaggregate data for purposes of understanding behavior of processes and systems and intervening on them. We developed control charts at the county and city/neighborhood level within one state (California) to illustrate their potential value for decision-makers. We found that COVID-19 rates vary by region and subregion, with periods of exponential and non-exponential growth and decline. Such disaggregation provides granularity that decision-makers can use to respond to the pandemic. The annotated time series presentation connects events and policies with observed data that may help mobilize and direct the actions of residents and other stakeholders. Policy-makers and communities require access to relevant, accurate data to respond to the evolving COVID-19 pandemic. Control charts could prove valuable given their potential ease of use and interpretability in real-time decision-making and for communication about the pandemic at a meaningful level for communities.
  • |COVID-19/diagnosis/*epidemiology[MESH]
  • |California/epidemiology[MESH]
  • |Cities/epidemiology[MESH]
  • |Humans[MESH]
  • |Models, Statistical[MESH]
  • |Residence Characteristics[MESH]


  • DeepDyve
  • Pubget Overpricing
  • suck abstract from ncbi

    Linkout box